Yesterday John Blackbourn publicly released Query Monitor, a brand new debugging plugin for WordPress. Query Monitor gives developers an easy way to monitor database queries, hooks, conditionals, HTTP requests, query vars, environment, redirects, and more. The repository is trending on github today as more WordPress developers are discovering it.
There are many excellent debugging tools available for WordPress, but this one does a few unique things that are truly noteworthy. Query Monitor provides automatic AJAX debugging and the ability to narrow things down by plugin or theme.
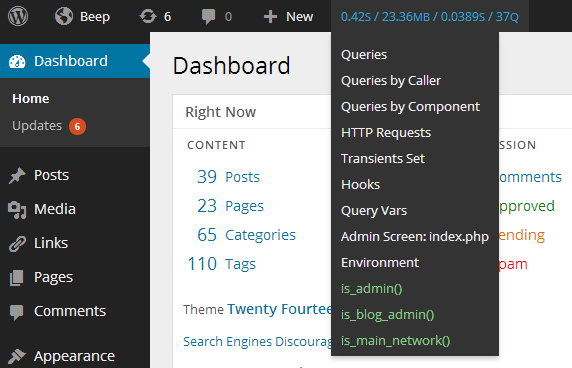
Once installed, the plugin adds a new admin bar menu that gives you a quick overview of the current page.
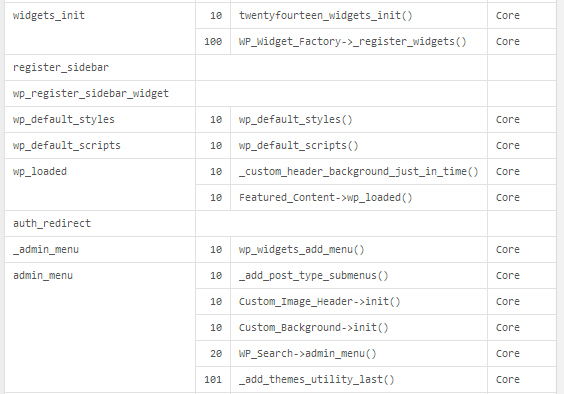
Click on any item in the menu and it will display complete data in the footer of the page. Here’s a sample output of clicking on “Hooks” in the Query Monitor menu. It displays all hooks fired on the current page with their priorities.
Query Monitor has more features than we can list here, but this is a quick very abbreviated list:
- Shows all database queries performed on the current page
- Shows affected rows and time for all queries
- Shows notifications for slow queries and queries with errors
- Shows any transients that were set, along with their timeout, component, and call stack
- Shows all WordPress conditionals on the current page, highlighted nicely
- Filter displayed actions by component (WordPress core, Plugin X, Plugin Y, theme)
- Shows the template filename for the current page
- Shows the available body classes for the current page
- Shows all HTTP requests performed on the current page (as long as they use WordPress’ HTTP API)
- Whenever a redirect occurs, Query Monitor adds an X-QM-Redirect HTTP header containing the call stack, so you can use your favorite HTTP inspector to easily trace where a redirect has come from
- Shows various PHP information such as memory limit and error reporting levels
- Shows various MySQL information, including caching and performance related configuration
That is only a small sampling of what is built into Query Monitor. You can use it to debug themes and plugins, find out why a WordPress site is running slow, track down mysterious redirects, and anything else you want to cook up.
I put the plugin on my dev environment and was blown away by how easy it is to use. The output is displayed in an organized, readable fashion. Query Monitor is aces. You can download the plugin from github or get it from wordpress.org via the WordPress admin. This is one debugging plugin you’ll want to bookmark for your toolbox.
Its like looking into the Matrix. All I can say is “Whoa”.